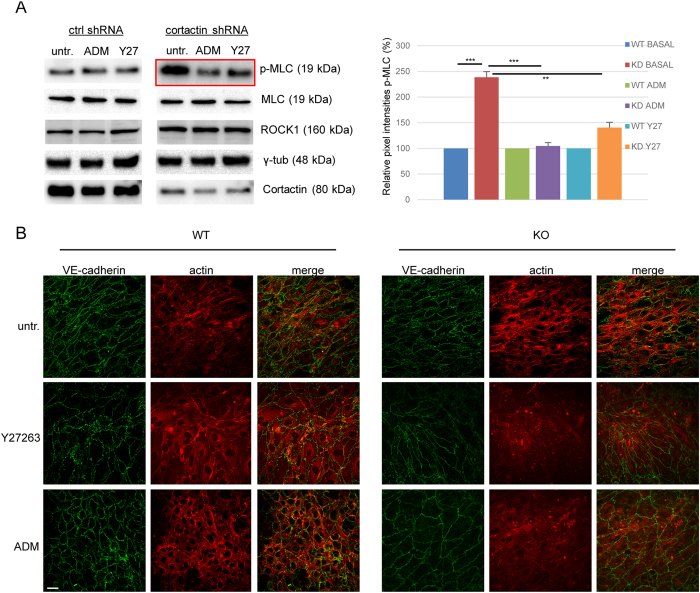
Figure 5. Adrenomedullin and ROCK1 inhibition counteract MLC phosphorylation and stress fibre formation.
(A) Western blot experiments for the indicated proteins show that both ADM treatment (100 nM) and ROCK1 inhibition with Y27632 (Y27, 10 μM) for 1 h reverse the increase in MLC phosphorylation after cortactin depletion (red box), while total MLC levels are unaffected. γ-tubulin served as loading control. Graph shows quantification of p-MLC from 3 independent experiments (WT = ctrl shRNA; KD = cortactin shRNA). **p < 0.01; ***p < 0.001. (B) Immunofluorescence images of MLEC showing that both ROCK1 inhibition (Y27632) and ADM treatment counteract the increase in stress fibres (red) in the absence of cortactin (KO). VE-cadherin as cell contact staining is shown in green. Representative images from three independent experiments are shown. Bar = 20 μm.

