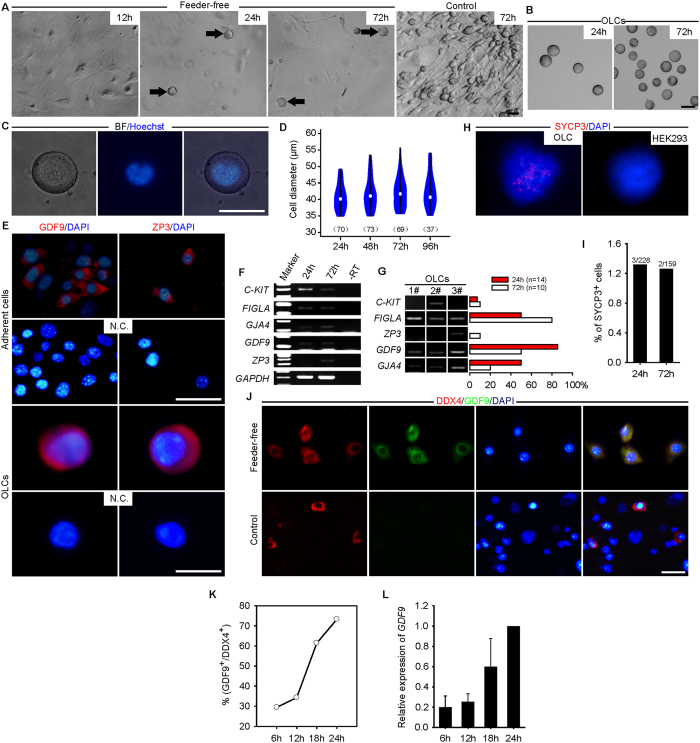
Figure 4. Spontaneous differentiation of candidate faFGSCs in vitro.
(A) OLCs (black arrows) appeared when faFGSCs cultured under a feeder-free condition begin at 24 h but not at 12 h or cultured similarly but on a feeder layer (control). (B) Groups of OLCs floating in the medium collected at 24 h and 72 h after faFGSCs cultured under a feeder-free condition. (C) Representative bright-field (left), Hoechst 33342 (middle), and merged (right) images of one live OLC. (D) Violin plots showing the distribution of the diameter of OLCs formed by faFGSCs after seeding with 2 × 10⁴ cells in each culture well. Numbers in brackets denote the number of OLCs measured. (E) Adherent germ cells (upper panel) and OLCs (lower panel) were detected by immunofluorescence analysis with the antibodies against GDF9 and ZP3 at 72 h. (F) RT-PCR analysis of mRNAs encoding oocyte-related genes at 24 h and 72 h. (G) Single-cell RT-PCR analysis of mRNAs encoding oocyte-related genes in OLCs. Proportion of each gene is shown on the right. (H) Meiotic spread assays of SYCP3 expression in OLCs collected in medium at 72 h (left) and in HEK293 cells (right). (I) Percentage of cells showing punctate SYCP3 staining. (J) Representative image of dual immunofluorescence analysis for DDX4 and GDF9 at 18 h when faFGSCs cultured under different conditions. (K) Quantification of GDF9+ cells in DDX4+ cells at 6–24 h after faFGSCs cultured under a feeder-free condition. (L) Relative expression of mRNAs encoding GDF9 in faFGSCs cultured under a feeder-free condition. Data are presented as mean ± SEM for three experiments. Full-length gels in F and G are presented in Supplementary Fig. 5. N.C. in (E) is omission of the primary antibody. Scale bars: 25 μm (J), 50 μm (A–C,E).

