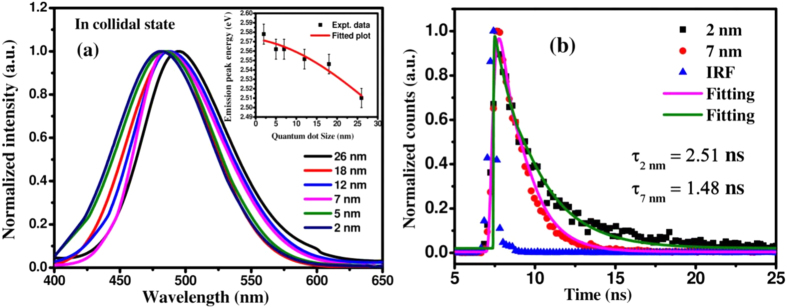
Figure 3.
(a) Typical PL characteristics of the synthesized QDs in solution exhibiting size tunable emission. Inset of figure (a) shows the variation of peak position as a function of dot diameter. (b) Photoluminescence decay spectra of 2 nm and 7 nm dia MoS2 QDs along with the instrument response function of TCSPS set up. Solid lines are fit to the experimental data using eqn. (1).

