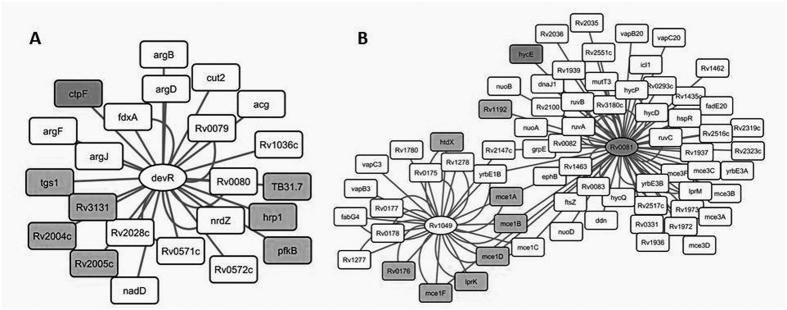
Figure 2. Network map of co-regulated groups of genes.
Ellipse and rectangles indicates TF and genes, respectively. Gray color indicates genes which correspond to under-represented proteins. White color indicates genes which correspond to proteins without changes or unidentified proteins. (A) Group of genes bound by TF devR/DosR; (B) Group of genes bound by TFs Rv0081 and Rv1049.

