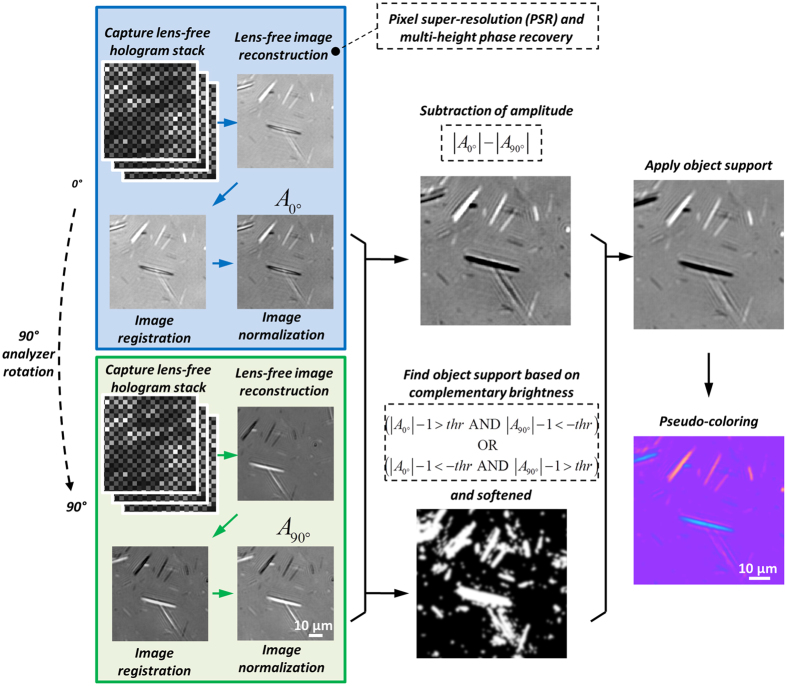
Figure 3. Image processing flow chart.
The blue box and the green box depict the processing of the lens-free hologram stack with the analyzer positioned at 0° and 90°, respectively. Then the image processing results are used in combination to obtain the amplitude-subtracted (differential) image and the object support. Finally the object support is applied to obtain a grayscale image, and pseudo-coloring is performed to create color contrast similar to a CPLM.

