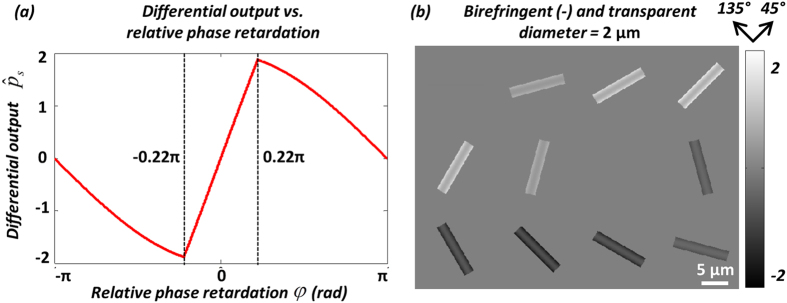
Figure 6.
(a) Simulation of the differential output  as a function of the relative phase retardation φ, with the crystals aligned at 45° (α = 45°).
  almost linearly reaches to the maximum/minimum when |φ| increases from 0 to ~ 0.22π, then turns backwards towards 0 as |φ| further increases to π. (b) Simulated image of a MSU crystal with larger diameter (2 μm) compared to Figs 4 and 5. The effect of the nonlinearity is manifested by the hollow appearance of the simulated images. Nevertheless, the intense (bright/dark) edges provide enough contrast for crystal detection and identification.

