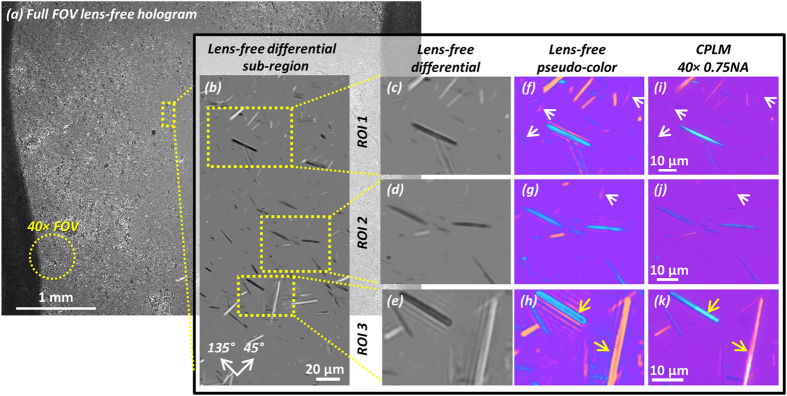
Figure 7. Experimental imaging result of a MSU crystal sample from a patient’s tophus, compared to a 40× 0.75NA CPLM.
(a) The full FOV of the lens-free hologram is 20.5 mm2 which is ~2 orders of magnitude larger compared to the FOV of a typical 40× microscope objective lens (see yellow dashed circle). (b) A sub-region showing the lens-free differential polarized image. Clearly the crystals oriented close to 45° (see orientation guide in the bottom left) appear brighter than the background, and those close to 135° appear darker. (c–e) Lens-free grayscale differential image of 3 ROIs taken from (b). (f–h) Pseudo-colored images of (c–e). (i–k) 40× 0.75NA CPLM images of the same regions as (f–h). White arrows: crystals that result in a weak signature have better contrast in the lens-free pseudo-color images (f,g) than the CPLM images (i,j). Yellow arrows: thick MSU crystals in the lens-free pseudo-color image (h) have hollow appearances, slightly different from the CPLM image (k).

