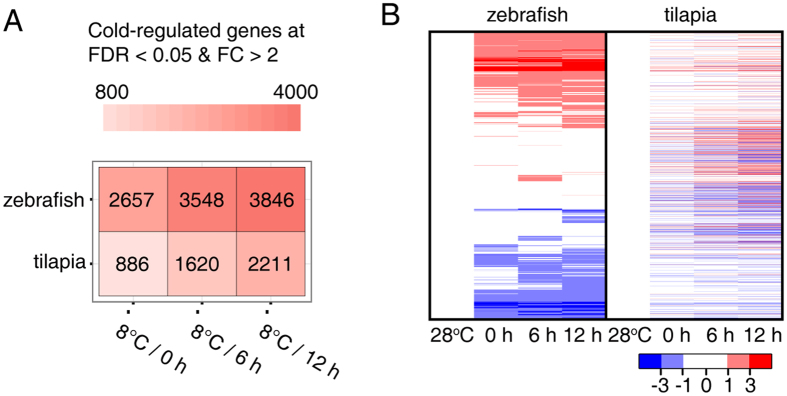
Figure 2. Global overview of differentially expressed genes at cold temperature in zebrafish and tilapia gills.
(A) The differentially expressed genes at three time points of 8 °C exposure identified by comparing with the 28 °C control fishes. (B) Clustered profiling of 3,174 differentially one-to-one orthologous genes in zebrafish (left panel) and tilapia (right panel) based on comparisons between orthologous gene pairs. Log2 transformation of gene fold induction is indicated by the color-coded scales.

