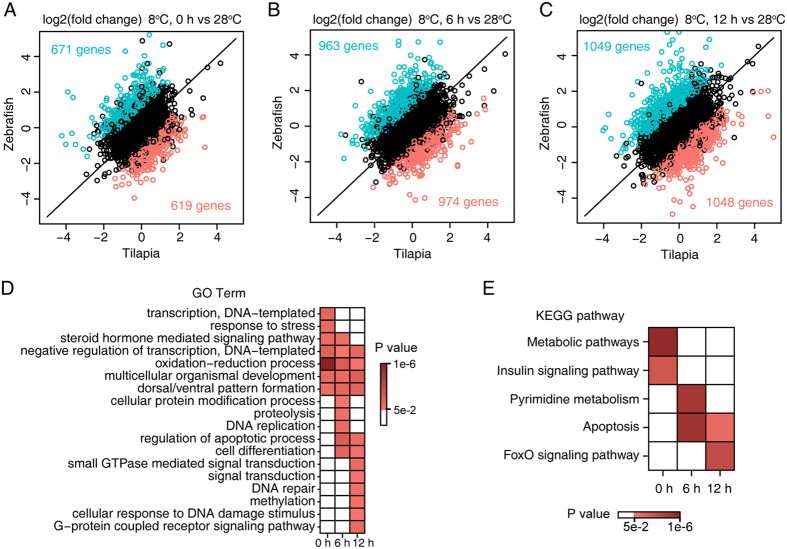
Figure 3. Divergent gene expression between zebrafish and tilapia in the LTL of tilapia.
1,290, 1,937 and 2,097 genes zebrafish/tilapia divergently expressed genes were identified at 0 h (A), 6 h (B) and 12 h (C), respectively. Green and red dots represent genes that are expressed in higher levels in zebrafish and tilapia respectively. (D,E) Heat map showing the enriched GO categories (D) and the KEGG pathways (E) identified from the zebrafish/tilapia divergently expressed genes at the three time points. The color scales depict the P values for the enrichment test, and cells in grey indicate a P value of >0.05.

