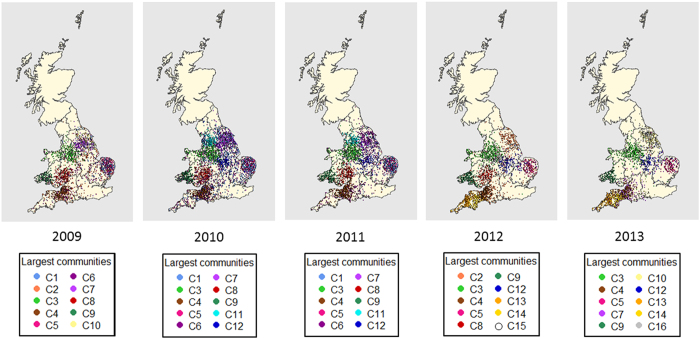
Figure 5. Spatial representation of the ten largest trade communities in each year (coloured according to community) including pig holdings, gathering areas and markets, over the 5-year study period (2009–2013) in England and Wales.
This map was created using R statistical software53 (version 3.0.2).

