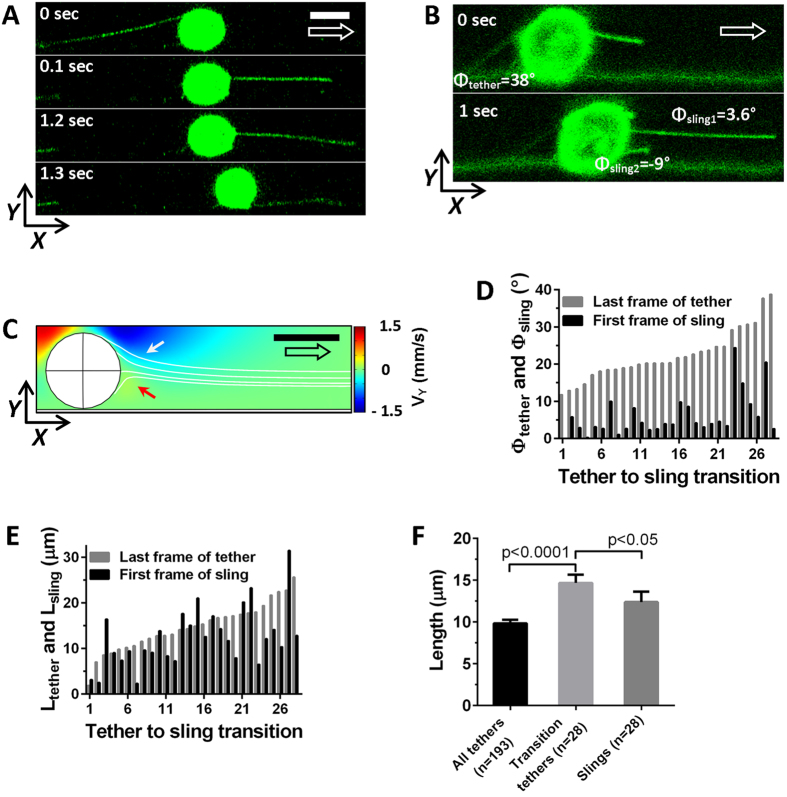
Figure 4. Tether-to-sling transition.
(A) Key frames of a tether-to-sling transition from a side view record. Transition happens within 100 ms, but it takes 1.2 sec until this sling reaches the substrate. During that period the sling would not be visible from the bottom view perspective. (B) Side view images allowed measuring the angle between the bottom surface and tethers (Φtether) or slings (Φsling). Two consecutive frames with a tether-to-sling transition are shown. (C) Computer fluid dynamic simulation of flow conditions around the neutrophil at 10 dyn/cm2 wall shear stress. The heat map indicates the direction and magnitude of the flow component perpendicular to the bottom surface (VY). At the right upper quadrant of the cell VY points down (indicated by white arrow) and at the right lower quadrant of the cell VY points up (indicated by red arrow). The four white lines originating on the right side of the cell indicate how the slings would align under the modeled stream conditions. (D) Last tether/first sling angle pairs were measured on tether-to-sling transitions. The angle pairs are shown as bar-doublets, where the gray bar represents tether angle and the black bar represents sling angle. Mean (±SEM) last tether angle = 22.3 ± 1.2°, min = 11.8°, max = 38.7°. Mean (±SEM) first sling angle = 6 ± 1°, min = 0°, max = 24.3°. (E) Final lengths of individual tethers (grey bars, min = 1.8 μm, max = 25.6 μm) and initial lengths of slings that originated from those tethers (black bars, min = 2.3 μm, max = 31.5 μm) for different tether-to-sling transitions. (F) Average (±SEM) lengths of final lengths of all tethers, tethers before tether-to-sling transitions (Transition tethers), and initial lengths of slings. Scale bars indicate 8 μm, large arrows indicates flow direction.

