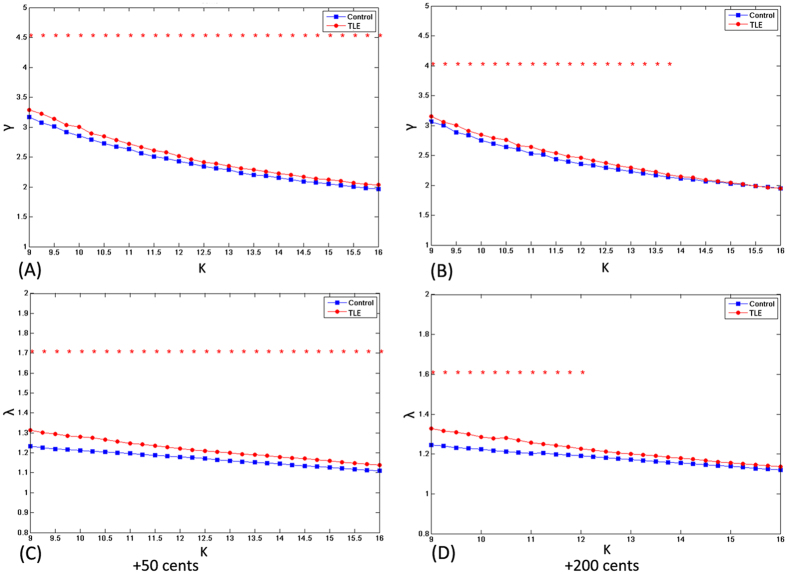
Figure 7.
Top γ in the case of +50 cents (A) and +200 cents (B) for patients with TLE (red dots) and healthy controls (blue squares). Bottom: λ in the case of +50 cents (C) and +200 cents (D) for patients with TLE (red dots) and healthy controls (blue squares). Red asterisks indicate where the difference between the two groups is significant (t-test, p < 0.05).

