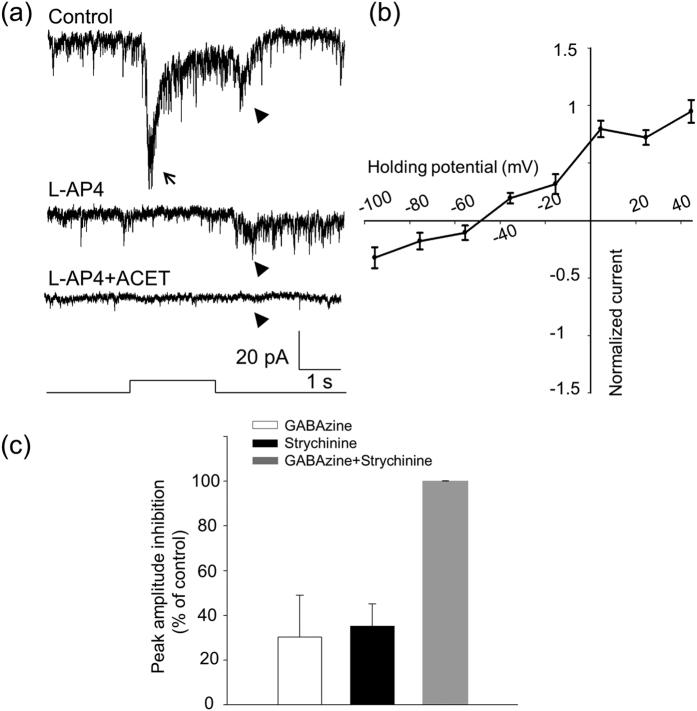
Figure 3. The OFF response of DACs is blocked by ACET and is an inhibitory current.
(a) A DAC displayed ON (indicated by an arrow) and OFF (indicated by an arrowhead) responses (top trace). The ON response was blocked by L-AP4 (middle trace), whereas the OFF response was eliminated by ACET (bottom trace). Stimulation bar under each trace shows timing of a 470-nm light pulse. Light stimulus duration was 2 s. (b) An I–V curve of the OFF responses shows that the reversal potential was −48.5 mV (n = 9). (c) GABAzine (white bar, n = 10) and strychnine (black bar, n = 8) each partially suppressed the peak amplitude of the OFF response, whereas their co-application completely blocked the response (grey bar, n = 8).

