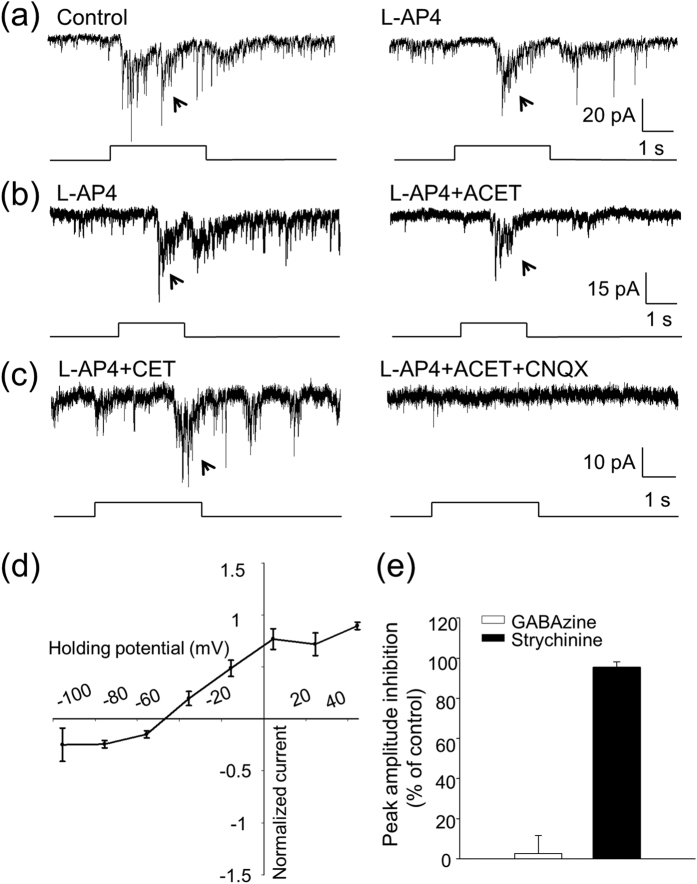
Figure 4. Pharmacological and biophysical properties of d-ON responses of DACs.
(a) A d-ON response (indicated by an arrow, left trace) was observed in a DAC, and was persistent in the presence of L-AP4 (right trace). (b) An L-AP4-resistant d-ON response (arrow, left trace) was not blocked by ACET (right trace) in another DAC. (c) An L-AP4 and ACET-resistant d-ON response (arrow, left trace) was completely blocked by CNQX (right trace) in this DAC. Stimulation bar under each trace shows timing of a 470-nm light pulse. Light stimulus duration was 3 s for (a) and (c) and 2 s for (b). (d) Normalized current–voltage relation of the peak d-ON responses. Data points represent average normalized values of the peak current amplitude at each voltage. The curve indicates that the reversal potential of the ON response was −46.5 mV. (e) GABAzine had almost no effect on the peak amplitude of the d-ON response (white bar, n = 11), whereas strychnine reduced the peak amplitude of the d-ON response by approximately 96% (black bar, n = 8).

