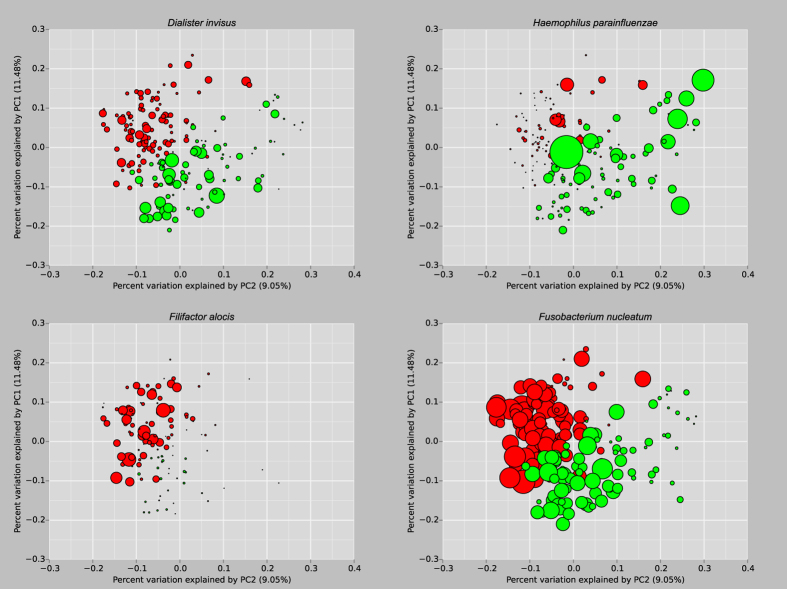
Figure 3. Principle Coordinate Analysis plots of never (green) and current (red) smokers (produced by the PhyloToAST script PCoA_bubble.py).
Each plot point represents a single study subject, scaled by relative abundance of the named species in the plot title9. Plots on top demonstrate species more highly abundant in non-smokers; below in smokers.

