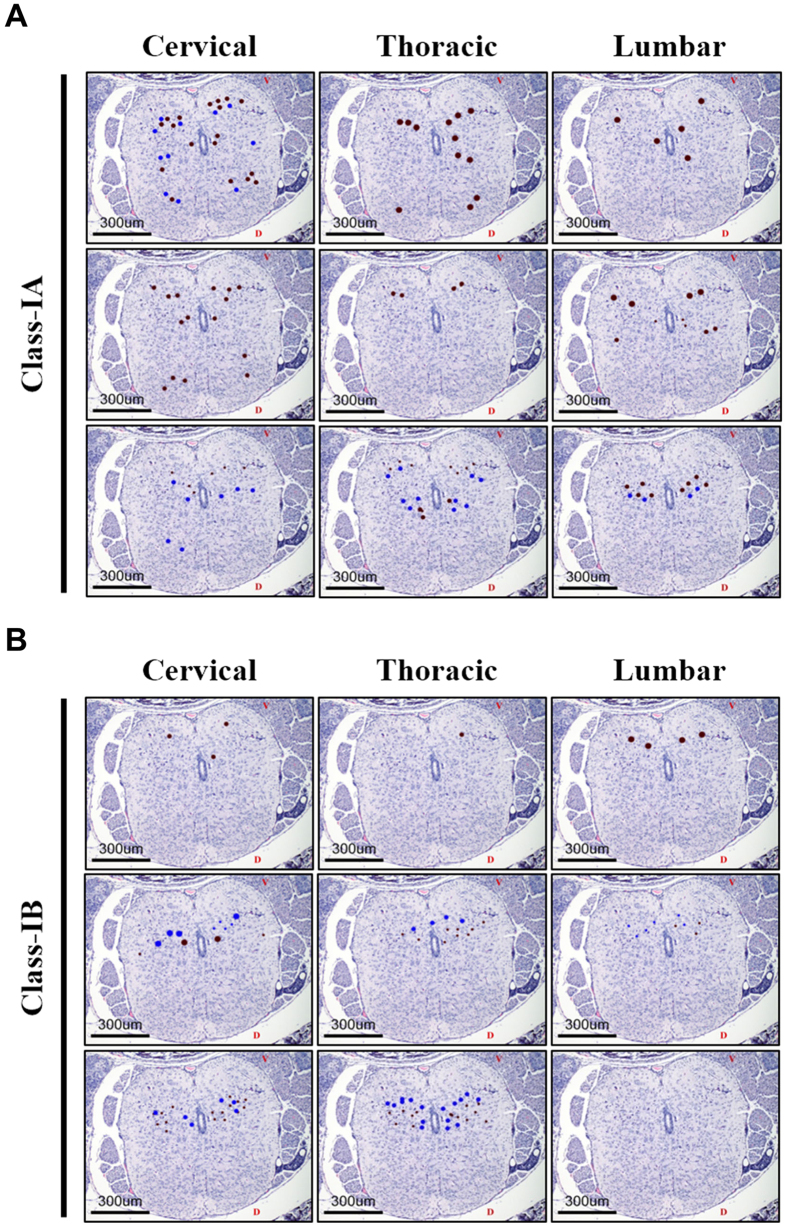
Figure 6. Localization and distribution of viral antigens and lesions in Class-IA and Class-IB mouse spinal cords.
Representative images of spinal cord coronal sections from Class-IA (A) and Class-IB (B) mice marked to show the localization of viral antigens (brown dots) and pathologic lesions (blue dots). Larger dot sizes indicate more intense signals or lesions. V, ventral side; D, dorsal side.

