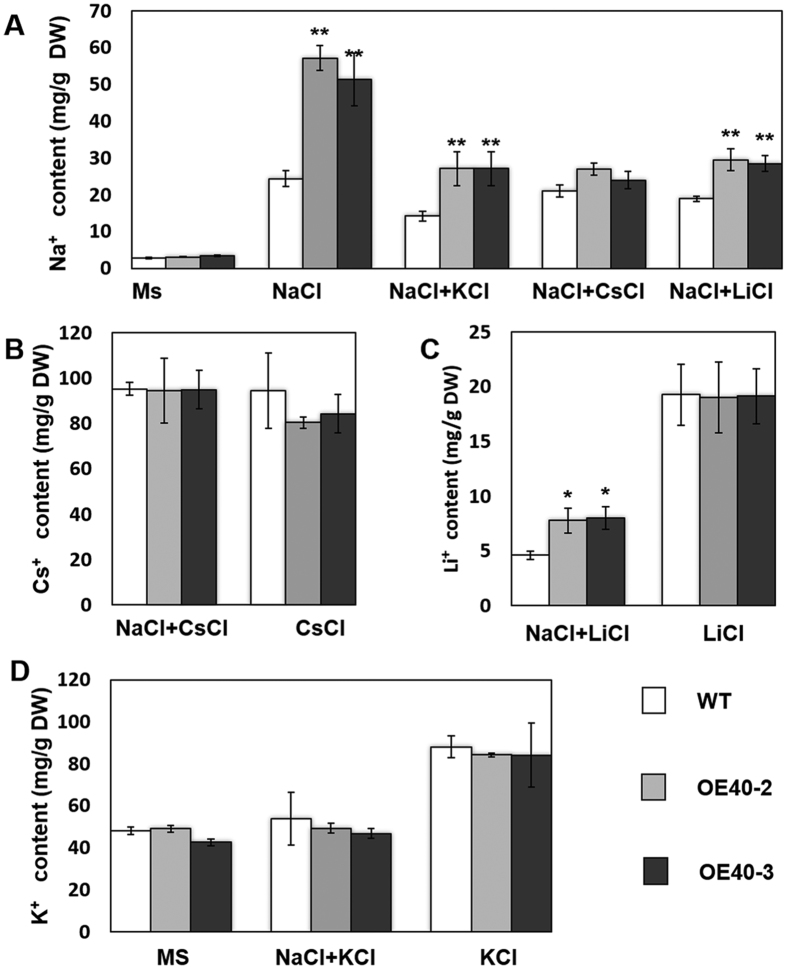
Figure 6. Ion contents in wheat roots treated with NaCl, KCl, LiCl and CsCl.
(A) Na+ contents: the wheat plants were watered with MS, 150 mM NaCl or 75 mM NaCl with 75 mM KCl/CsCl/LiCl. (B) Cs contents: the wheat plants were watered with 150 mM CsCl or 75 mM CsCl with 75 mM NaCl. (C) Li+ contents: the wheat plants were watered with 150 mM LiCl or 75 mM LiCl with 75 mM NaCl. (D) K+ contents: wheat plants were watered with MS, 150 mM KCl or 75 mM KCl with 75 mM NaCl. The samples were harvested 24 hours later. Bars represent the mean ± SD (n = 3, *P < 0.05, **P < 0.01 by Student’s t-test).

