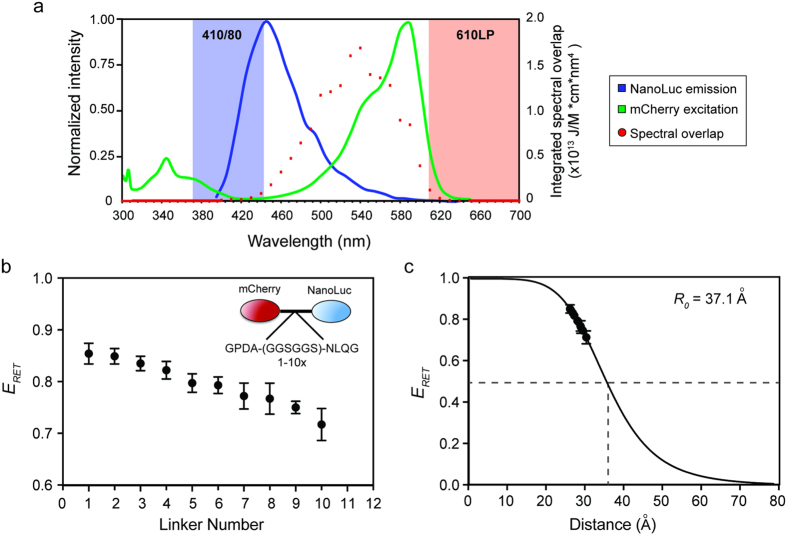
Figure 1. Determination of BRET parameters for the Nanoluciferase/mCherry combination.
(a) The normalized emission spectrum of Nanoluciferase (NanoLuc) and excitation spectrum of mCherry are shown in relation to the filter sets used to detect emission from each molecule. Nluc emission was detected using a 410 nm peak filter with an 80 nm bandwidth (blue shading), while mCherry emission was detected with a 610 nm longpass filter (red shading). Both filter sets optimally detect light well outside of the overlap region in which bioluminescent resonance energy transfer occurs. (b) The resonance energy transfer efficiency (ERET, equation 3) was calculated from spectral emission data for a series of vectors in which mCherry and Nluc were tethered by different numbers of a hexapeptide repeat (inset) of known dimensions. Error bars represent standard deviation of averaged values across three separate experiments. (c) Fitting of RET efficiency values and physical distances between mCherry and Nluc to the Förster equation using a Förster radius of 37.1 angstroms (see Table 1) gives a line fit of r2 = 0.9995, demonstrating good correlation of experimental data to the theoretically predicted value.

