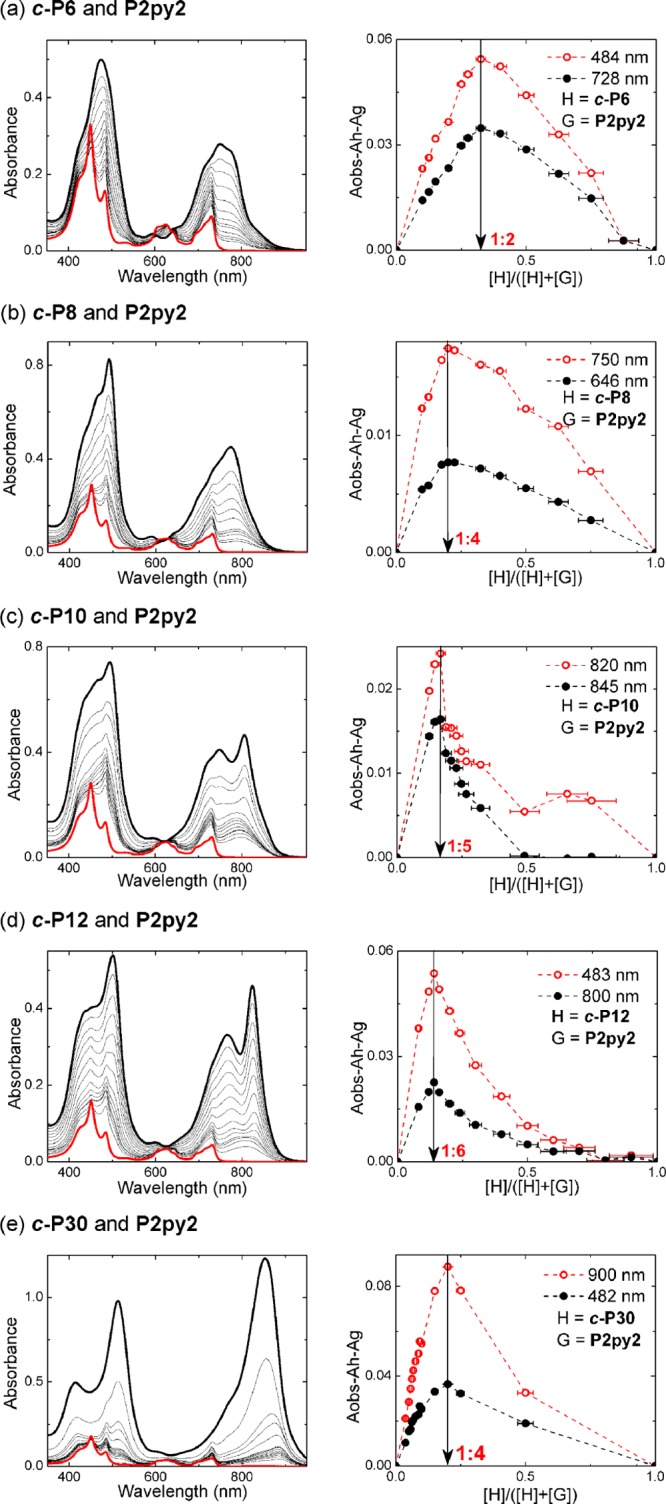
Figure 1.

Job plots for nanoring-dimer complexes (all in toluene at 298 K). (Left) The UV–vis-NIR spectra upon varying mole fraction of nanoring from 0 (thick red) to 1 (black lines). (Right) Job plots of the complex formations with red and black dots corresponding to the absorbance difference as shown in the legend. Red and black dashed lines are given as a guide to the eye.
