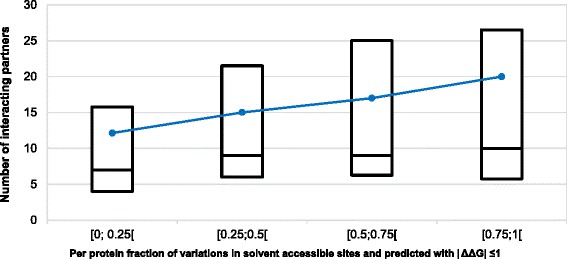
Fig. 4.

Relation between the per-protein fraction of non-perturbing, solvent accessible variations and the corresponding number of the wild-type partners of interactions in the human interactome. The box-plot reports the median and the lower and upper quartiles of the number of interactions present in IntAct as a function of the fraction of solvent accessible, non-perturbing variations. The dashed blue line connects the average values. Non perturbing variations are those predicted to promote a |ΔΔG| ≤ 1 kcal/mol with INPS3D and found in protein sites that are solvent accessible. Data refers to 170 proteins with 4037 variations of our data set. Proteins with less than 5 disease-related variations or without interactomic data reported in IntAct are excluded
