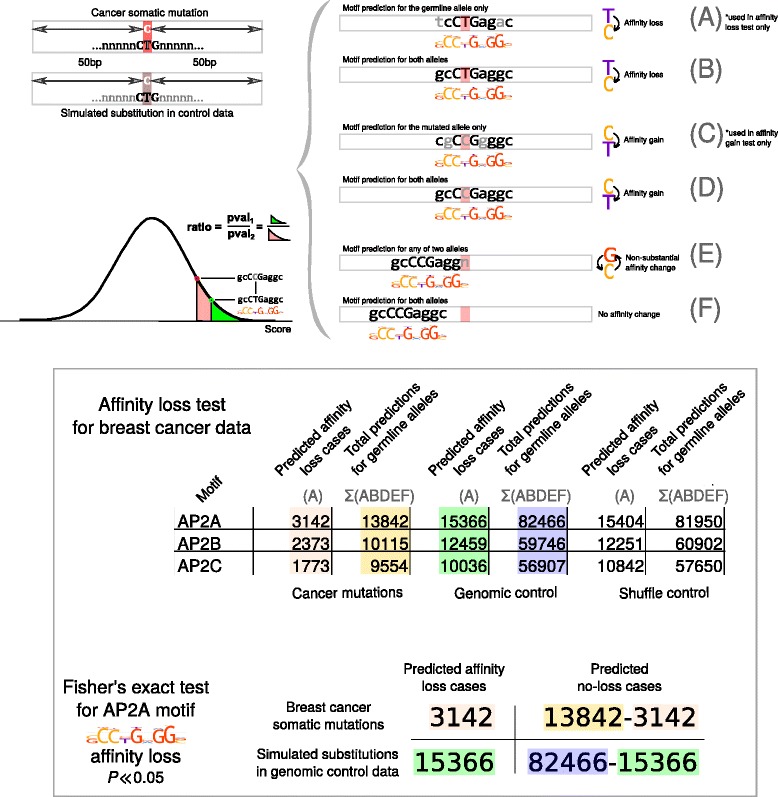
Fig. 1.

Procedure used to evaluate affinity change events and estimate significance of difference between observed and expected frequencies. Top panel: prediction of binding sites in cancer and control data and evaluation of affinity change events. Bottom panel: binding sites predictions and affinity change events of AP-2 motifs; an example of 2 × 2 contingency table used to compute Fisher’s exact test P-value
