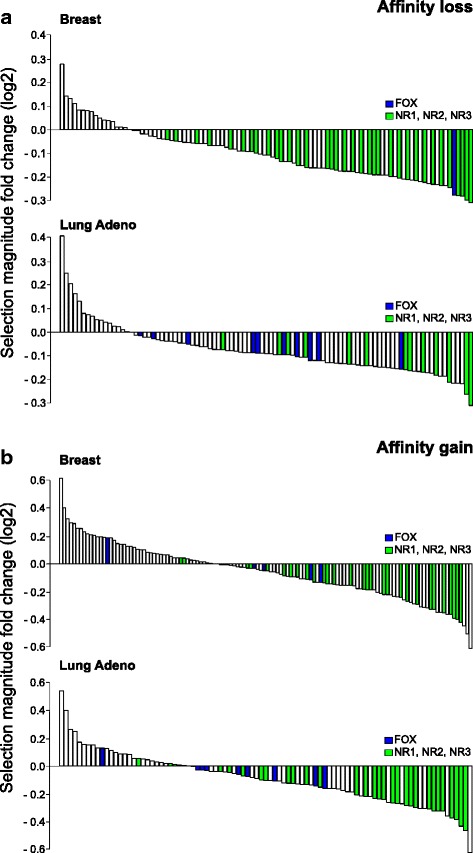
Fig. 6.

Fold change (log2) of negative selection magnitude for mutations in DNase accessible subregions compared to that in the promoter and intronic segments. Y axis displays selection magnitude fold change (log2), the ratio between selection magnitudes estimated for DNase accessible regions to those for all promoter and intronic segments, the respective genomic control data is used in the both cases. Lower values of selection magnitude correspond to the stronger negative selection, thus negative fold change values correspond to stronger negative selection in DNase accessible regions. X axis displays different significantly conserved motifs (P < 0.05) for the set of promoter and intronic mutations. Data for affinity loss (a, top panel) and affinity gain (b, bottom panel) is presented for breast cancer (top subpanels) and lung adenocarcinoma (bottom subpanels). Members of FOX and NR transcription factor families are colored in blue and green
