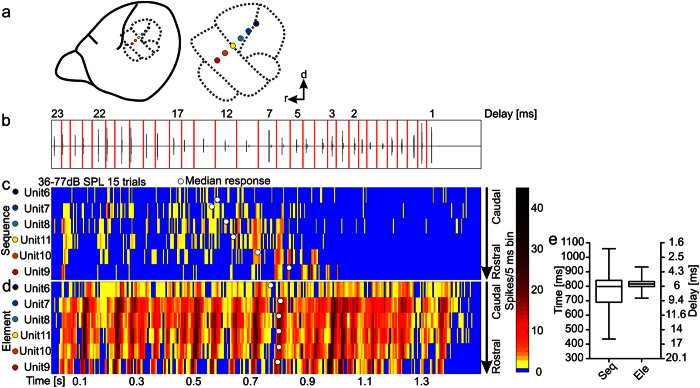
Figure 4. Suppression results in strong topographic organization of echo-delays along the rostro-caudal axis of the brain.
(a) Schematic lateral view on C. perspicillata’s brain and magnified auditory cortical areas (dashed lines). Colored spots denote electrode positions from a single experiment. The linear electrode array was positioned along the rostro-caudal axis of the high frequency area and high frequency tuned neurons of the primary auditory cortex. d = dorsal, r = rostral. (b) Oscillogram of the echolocation sequence. Vertical red lines indicate borders between different call-echo elements that were used for segmenting the sequence. Echo delays ranged from 22.8 to 1.1 ms. (c,d) Color-maps with a binsize of 5 ms show the activity pattern of six multi-units in response to the “sequence” and “element situation” at the highest sound level. Each row represents the activity pattern from one unit in response to 15 averages. The units were recorded simultaneously from the auditory cortex and their positions follow the chronotopy along the rostro-caudal axis of the cortex (a). Note that the suppression leads to sharper delay tuning and to a more distinct topographic organisation along the rostro-caudal axis in the “sequence situation” (c). In the element situation, the chronotopy is hardly detectable (d). White dots in the color-maps represent time point of the median response for each unit. (e) Boxplots (whiskers represent minimum and maximum values) showing the distribution of median responses in 149 units. Note that more delays are covered in the “sequence” than in the “element situation”. Thus at the neuronal population more delays are represented in the “sequence situation”.

