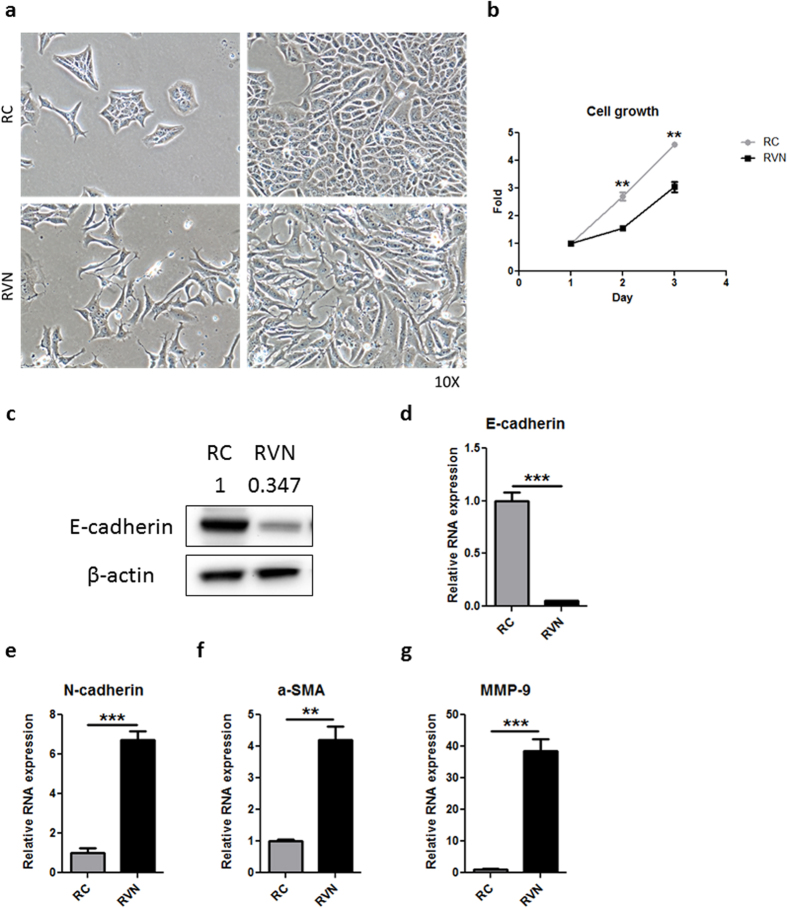
Figure 2. VHL loss induces morphologic and molecular changes indicative of EMT.
(a) Phase contrast 10X images of RC and RVN cells at low (left) and high (right) densities. (b) Growth chart of RC versus RVN cells. (c) Western blot for murine E-cadherin and β-actin in RC and RVN cells. Normalized quantification by densitometry shown above blot. Gene expression was analysed by RT-PCR for (d) E-cadherin, (e) N-cadherin, (f) α-SMA and g) MMP-9. n = 3 for proliferation assay and RT-PCR, **denotes p < 0.01, ***denotes p < 0.001.

