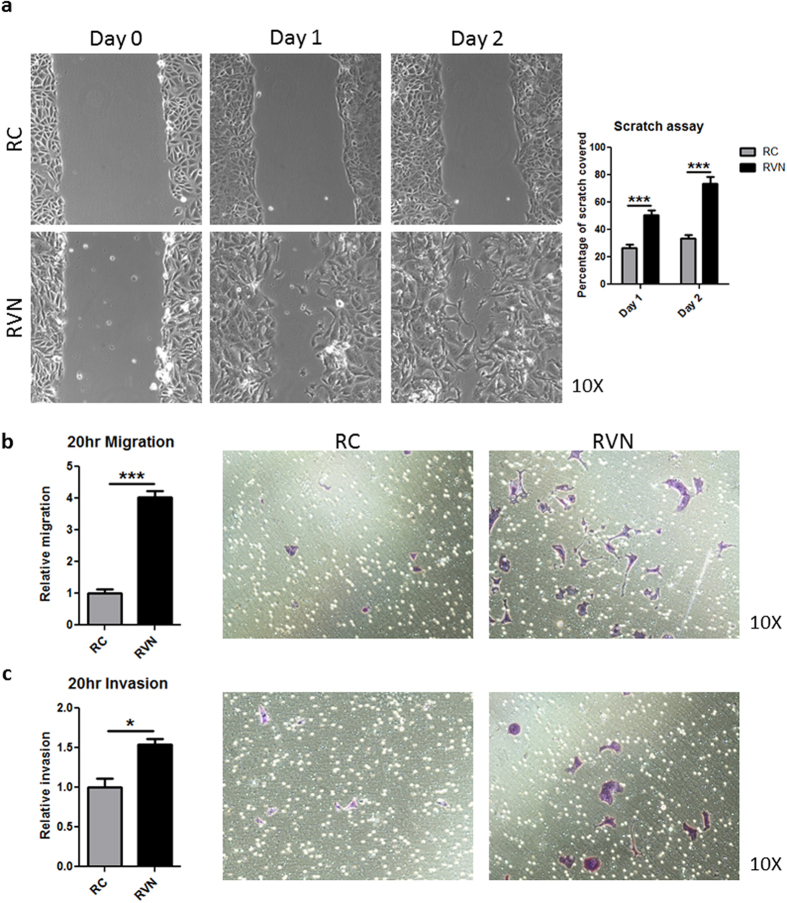
Figure 3. VHL knockout induces increased RENCA cell migration and invasion in vitro.
(a) Images of a scratch assay were taken at the same location one and two days after scratching. Representative images of each cell type are shown (left) and quantification of scratch filling is shown to the right. (b) Quantification (left) and representative images (right) of RC and RVN migration are shown. (c) Quantification (left) and representative images (right) of RC and RVN invasion are shown. n = 7 for scratch assay, n = 3 for migration and invasion assays, *denotes p < 0.05, ***denotes p < 0.001.

