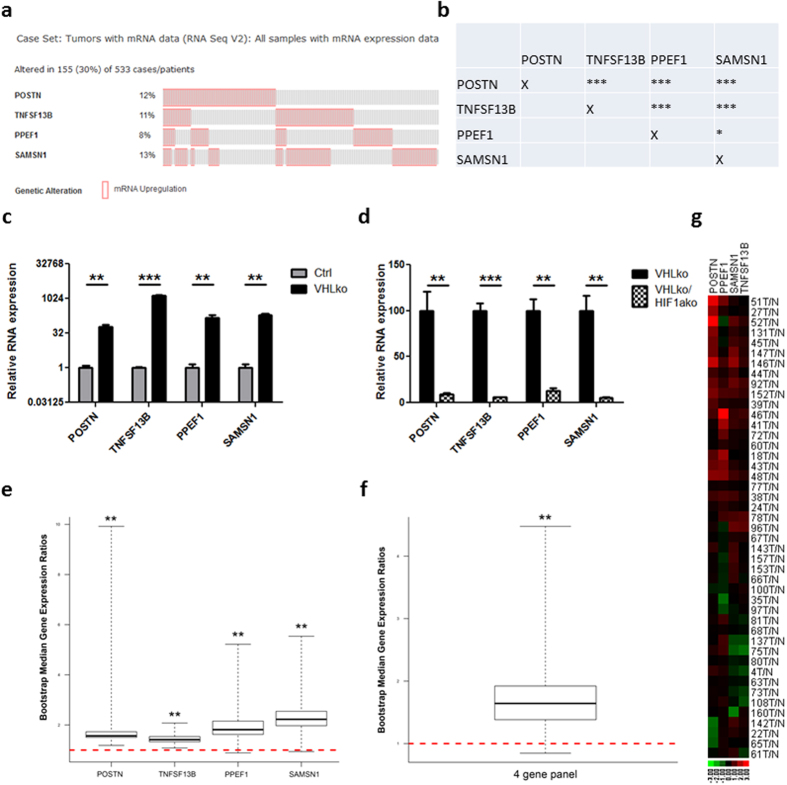
Figure 6. Four-gene signature shows frequent co-occurrence and upregulation in ccRCC samples.
(a) Frequency (%) of having upregulation one standard deviation higher than the mean for each of the four genes in the TCGA ccRCC database is given (left of each row). Each column represents one individual patient. Data for all patients with at least one upregulated gene is shown. (b) Table of co-occurrence analysis for the four genes. Gene expression was analysed by RT-PCR for POSTN, TNFSF13B, PPEF1 and SAMSN1 comparing (c) Ctrl and VHLko RENCA cells and (d) VHLko and VHLkoHIF1ako RENCA cells. Expression of these four genes was assessed in 45 clinical ccRCC samples from radical nephrectomies. Comparison of gene expression between tumour and normal adjacent tissue was analysed BootstRatio method for (e) each individual gene and (f) the 4 gene panel. (g) Heat map demonstrating expression of these four genes in each of the 45 clinical ccRCC samples. *denotes p < 0.05 **denotes p < 0.01 ***denotes p < 0.001.

