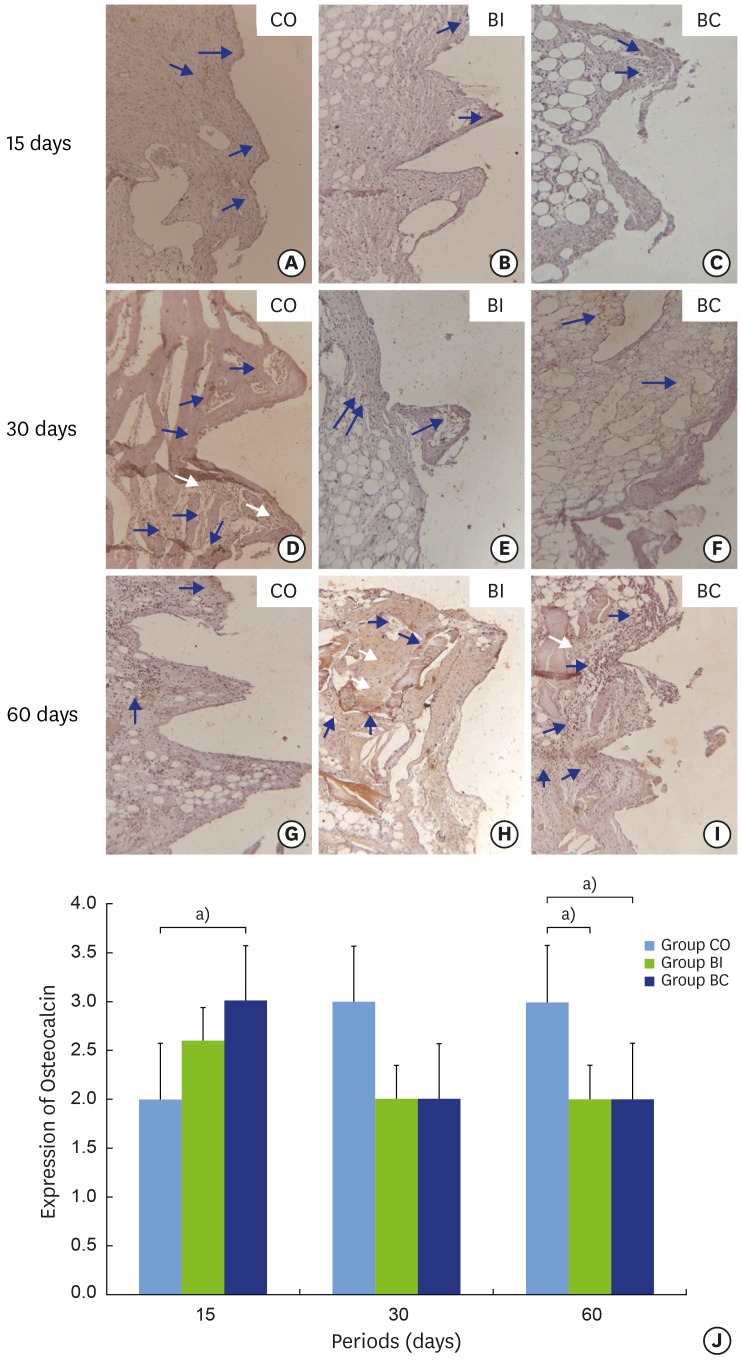
Figure 6.
Light micrographs of sections submitted to immunohistochemical analysis for detection of osteocalcin (OC). Samples from implant thread tissues in CO (6A, 6D and 6G), BI (6B, 6E and 6H), and BC (6C, 6F and 6I) groups at 15 (6A-6C), 30 (6D-6F) and 60 days (6G-6H). Graphic representation of balanced OC labeling over time(6J). Blue arrows: labeling in cytoplasm; White arrows: background labeling.
a)Statistically significant between indicated groups, P<0.05.

