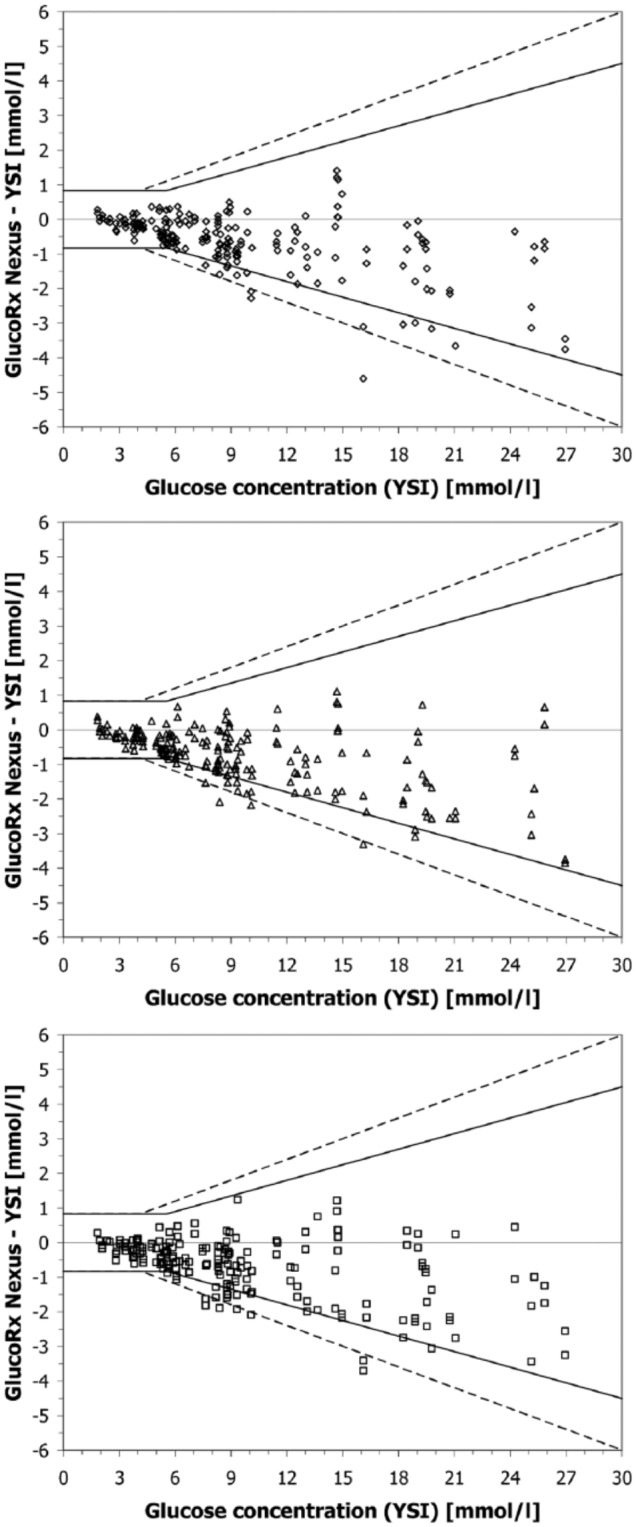
Figure 1.

Absolute differences between BGMS results and comparison measurement results for lot 1 (top), lot 2 (middle), and lot 3 (bottom). For each lot, 200 data points (measurement of 100 samples in duplicate) are shown. Solid lines indicate system accuracy limits of ISO 15197:2013; dashed lines indicate limits of ISO 15197:2003.
