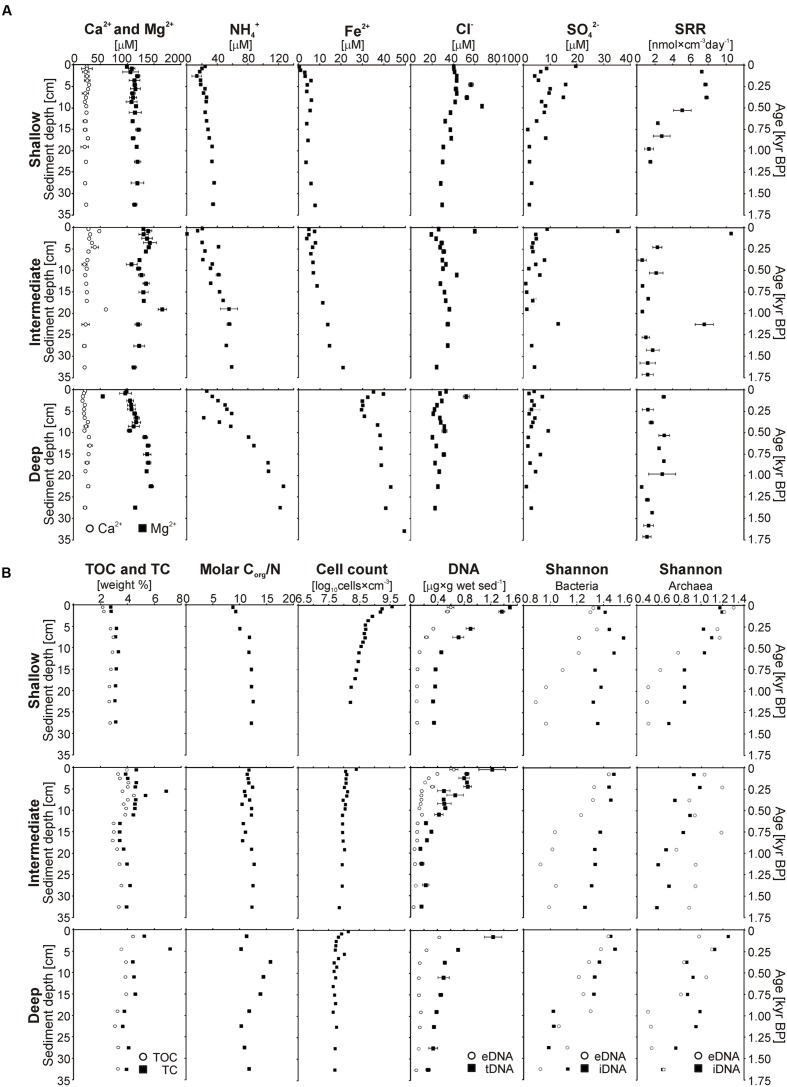
FIGURE 3.
Multiple profiles established on short sediment cores. For consistency, results for the three different sites are displayed vertically according to their water depths. (A) From left to right: Total organic carbon and total carbon (wt%); molar Corg/N ratio measured in bulk sediments; calcium, magnesium, chloride, and sulfate concentrations (μM) measured in the pore water; potential sulfate reduction rates (nmol × cm-3 day-1) obtained after 24 h incubation experiments; ammonium concentrations (μM) in the pore water measured by cell dialysis. (B) From left to right: Cell counts in log scale (log10 cells × cm-3); concentrations of extracellular DNA (gray dots) and total DNA (black squares) (μg × g wet sediment-1), with distance between the two curves corresponding to intracellular DNA concentrations; Shannon index established from bacterial and archaeal DGGE gel features, with eDNA (gray dots) and iDNA (black squares) displayed separately; range-weighted richness index for bacterial DNA (square) and archaeal DNA (dots), with eDNA (gray) and iDNA (black) displayed separately.

