
Fig. 2.
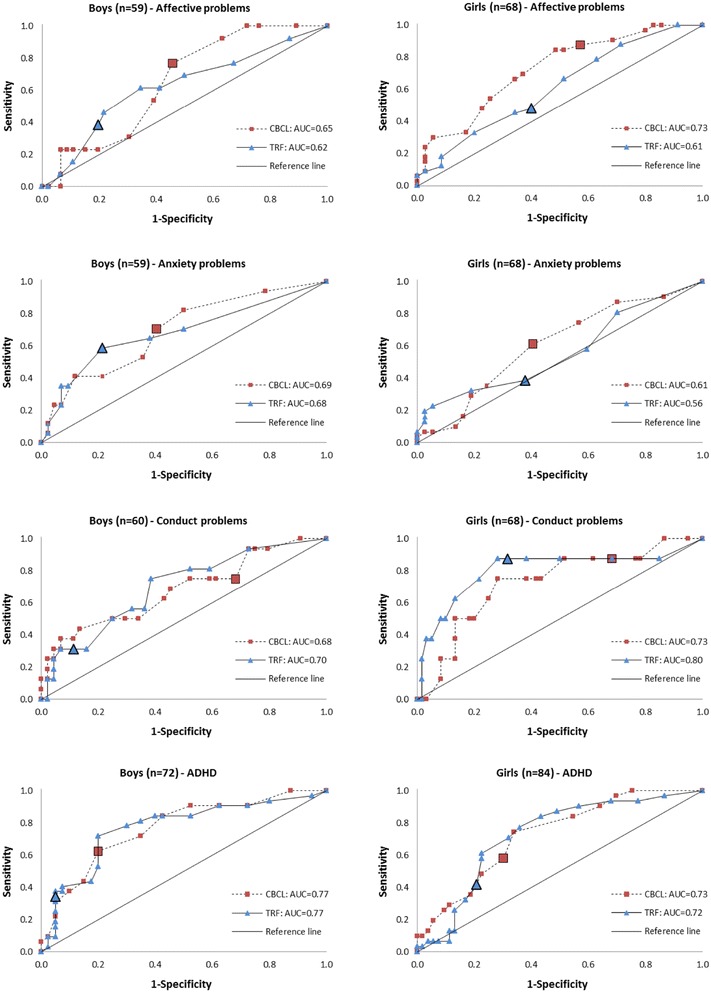
ROC curves (receiver operating diagnostic curve) connecting corresponding values of sensitivity and specificity for the CBCL and TRF with the CAPA diagnostic standard. The enlarged symbols (square and triangle) represent the sensitivity and specificity obtained using the defined cut-off values in Table 1