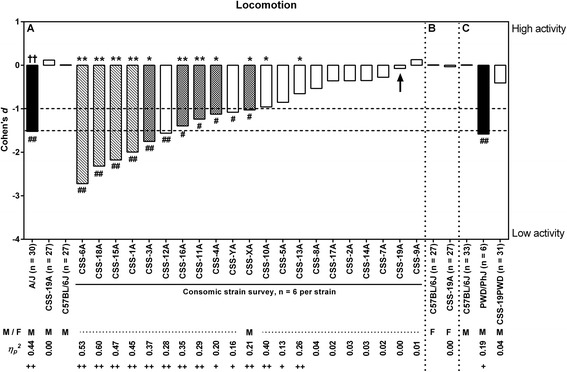
Fig. 2.

Effect sizes for activity-related behavior. The effect sizes (Cohen’s d and η p 2) show the relative magnitude of the strain differences compared to C57BL/6J of each experiment Inferential statistical comparison resulted in suggestive evidence * = 0.004 ≤ P < 0.05 for the consomic panel. For all other comparisons: ** = P < 0.004. (Chromosomal) effects are indicated as: # = Large (1.0 ≤ |d| < 1.5), ## = Very Large (|d| ≥ 1.5), + = Large (0.10 ≤ η p 2 < 0.20) and ++ = Very Large (η p 2 ≥ 0.20). M = males, F = females. Black bars: donor strains, white bars: CSS with no evidence for a meaningful QTL, chequered bars: CSS with suggestive evidence for a meaningful QTL, bars with diagonal pattern: CSS with significant evidence for a meaningful QTL
