
Fig. 2.
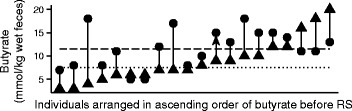
Median butyrate concentrations for each individual before (triangles) and during consumption of RS (circles). Dotted and dashed lines denote the median values for butyrate before and during RS, respectively, for the entire study population
Official websites use .gov
A
.gov website belongs to an official
government organization in the United States.
Secure .gov websites use HTTPS
A lock (
) or https:// means you've safely
connected to the .gov website. Share sensitive
information only on official, secure websites.
Median butyrate concentrations for each individual before (triangles) and during consumption of RS (circles). Dotted and dashed lines denote the median values for butyrate before and during RS, respectively, for the entire study population