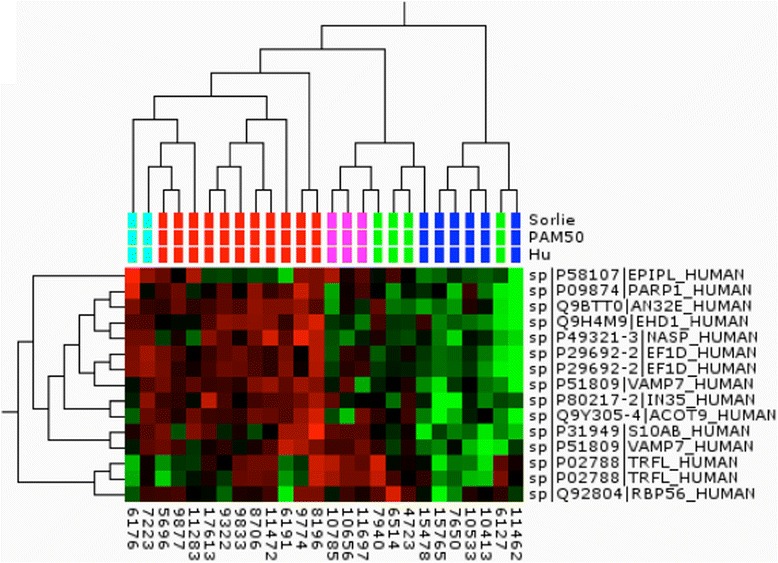
Fig. 4.

Cluster analysis of the “core set” of tumors using analysis of variance filtering (p value 0.01). The tumor classification according to three gene expression profiling methods is indicated below the branching and colored accordingly: red basal-like, magenta HER2, green normal-like, blue luminal A, turquoise luminal B. Proteins are indicated with the SwissProt ID and short name
