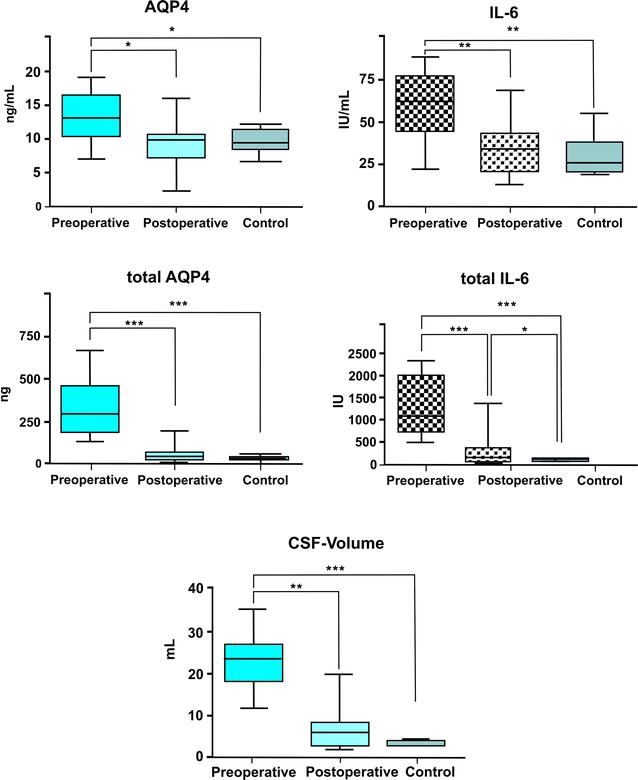
Fig. 4.

Box and Whisker diagrams demonstrating differences in the mean/median, 25/75 % percentile and minimum-maximum of the, aquaporin-4 (AQP4) and interleukin-6 (IL6) concentrations in the cerebrospinal fluid before and 3 months after surgery compared to controls (top row). The total quantity of both parameters AQP4 and IL6 (middle row) was calculated by multiplying by the ventricular volume (bottom graph). Significant differences are marked with asterisks (*P < 0.01; **P <0.001; ***P < 0.0001, n = 14, 14, 10 for preoperative, postoperative and control groups, respectively
