
Fig. 3.
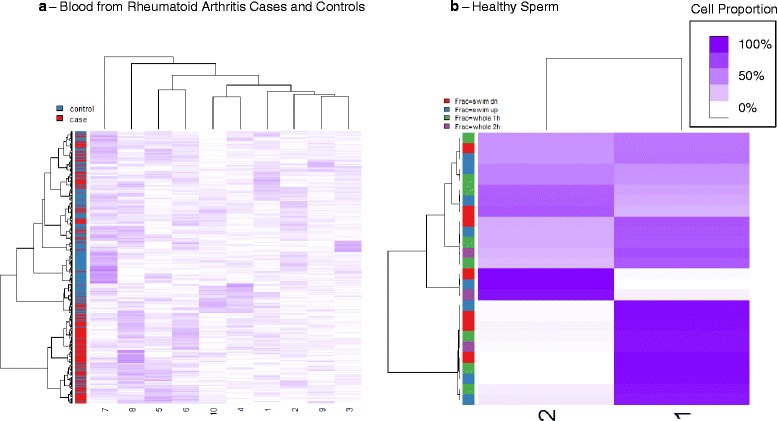
Cell Proportion Matrices. Clustering heatmaps of cell proportion matrix Ω for two data sets; purple intensity indicates cell proportion. a Blood from rheumatoid arthritis cases and controls (BL-ra, ); clustering heatmap obtained from untransformed coefficients and using Ward’s method of clustering (“ward.D” in R hclust function). b Sperm (SP, )