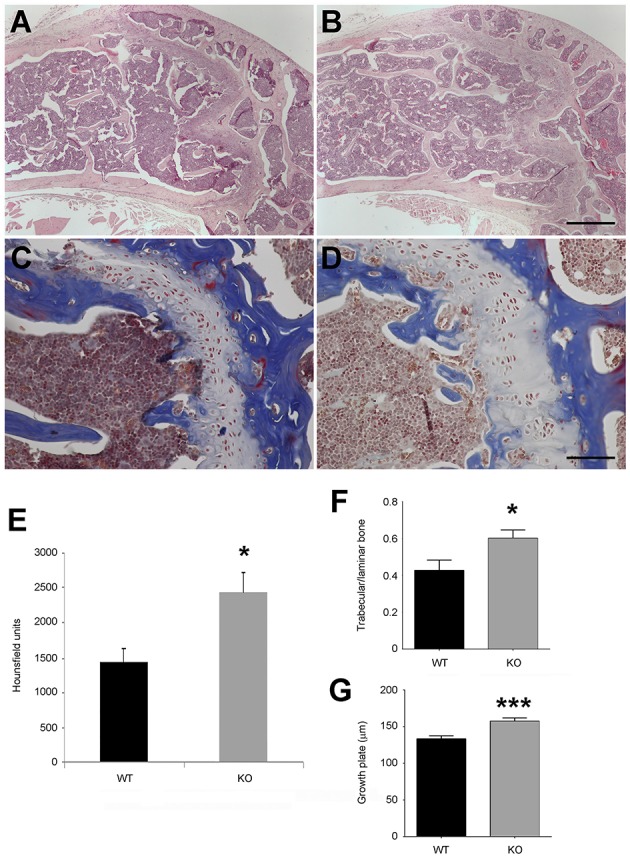
Figure 3.

Bone parameters in WT and KO mice. Histological sections of the head of the femur in WT (A,C) and KO (B,D) animals, stained with hematoxylin and eosin (A,B) or with Masson's trichrome (C,D). Femur bone density was measured in both genotypes (E). The ratio trabecular vs. laminar bone (F) and the thickness of the growth plate (G) was calculated for both genotypes. Each bar represents the mean ± SD of all mice. *p < 0.05; ***p < 0.001. Bar for (A,B) = 500 μm. Bar for (C,D) = 100 μm.
