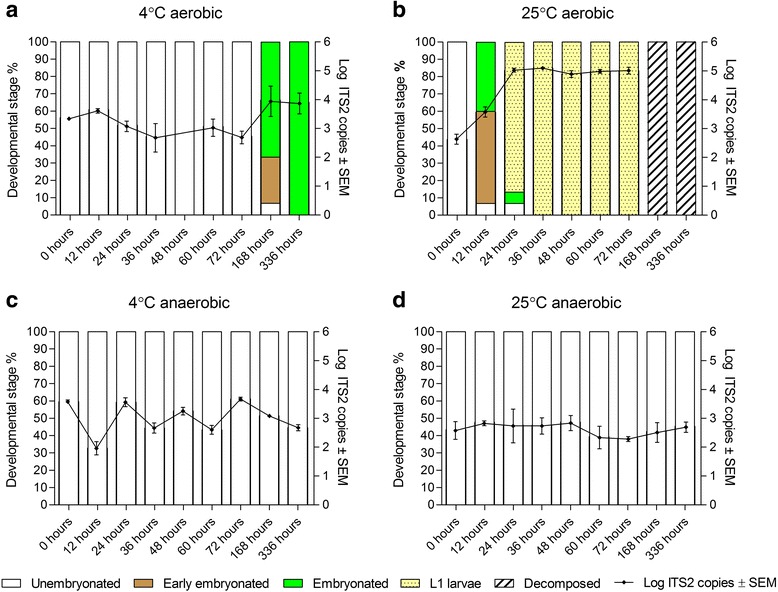
Fig. 3.

Log-transformed ITS2 copies plotted against developmental stages of Ostertagia ostertagi throughout the four sub-experiments. a 4 °C under aerobic conditions. b 25 °C under aerobic conditions. c 4 °C under anaerobic conditions. d 25 °C under anaerobic conditions. The X-axis indicates storage time. Distributions (%) of developmental stages are plotted on left Y-axis (white bar: unembryonated eggs; brown bar: early embryonated eggs; green bar: embryonated eggs; yellow dotted bar: L1 larvae; shaded bar: decomposed parasites). Developmental stage was determined from photographs of 15 randomly selected eggs from each of nine time points. Log-transformed ITS2 copies are plotted on right Y-axis and are indicated by a black line. ITS2 copies were obtained from qPCR analysis of biological triplicate samples containing DNA from 25 parasites (eggs or larvae). Error bars indicate standard error of the mean (SEM) of log-transformed ITS2 copies
