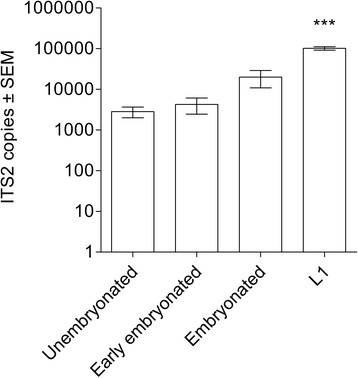
Fig. 4.

ITS2 copies of four developmental stages of Ostertagia ostertagi. Sample mean of ITS2 copies (molecules μl-1) illustrated on the Y-axis plotted against each developmental stage (X-axis). Error bars indicate standard error of the mean (SEM). Asterisks denote statistical significance: *** = P < 0.0001
