Fig. 10.

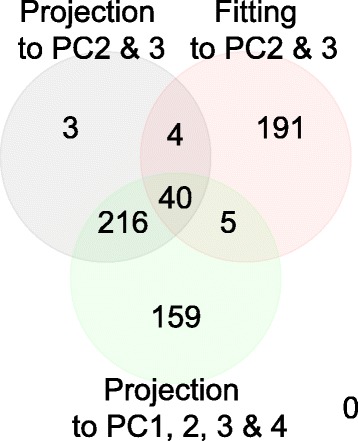
Venn diagram between genes identified by PCA based unsupervised with PC2 and PC3 (gray), with PC1, PC2, PC3 and PC4 (green) and by FE based upon fittings to PC2 and PC3 (red), in YMC [13]

Venn diagram between genes identified by PCA based unsupervised with PC2 and PC3 (gray), with PC1, PC2, PC3 and PC4 (green) and by FE based upon fittings to PC2 and PC3 (red), in YMC [13]