
Fig. 2.
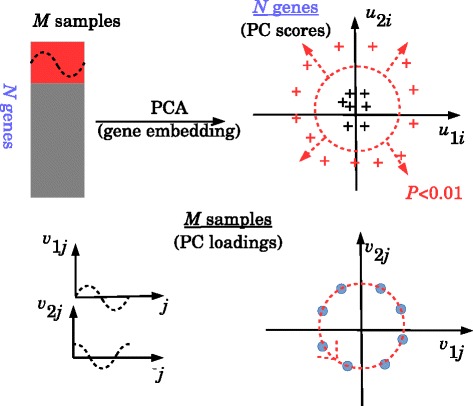
Schematic of PCA based unsupervised FE. In gene expression analyses (top left), limited genes (red) exhibit periodic motion. After gene embedding (top right), genes exhibiting periodic motion (red crosses) are identified as outliers if the BH criterion adjusted P-values are lower than 0.01 (or 0.05) assuming that the PC score attributed to each gene obeys Gaussian distribution. This is because PC loading attributed to each sample exhibits periodic motion (bottom)