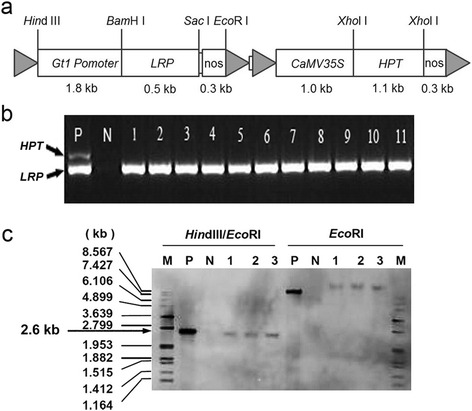
Fig. 1.

Construction of pSB130-LRP and molecular identification of transgenic plants. a Structure of pSB130-LRP. Empty boxes denote the GT1 promoter, LRP-coding region, nos terminators, CaMV 35S and HPT gene. Grey triangles denote the 4 T-DNA borders of the 2 T-DNA regions. The top panel indicates the restriction enzyme sites in the construct, and the bottom panel indicates the length of each element. b PCR analysis of the HYH-free line in the T2 generation. P, positive control with the pSB130-LRP plasmid; N, negative control with PA64S. Lanes 1–11 indicates 11 plants of one LRP transgenic line. c Southern blot analysis of the LRP transgenic line digested with two restriction enzymes HindIII/EcoRI or only EcoRI. Lanes 1–3 indicates 3 plants from one LRP transgenic line. M, P, N, denote the DNA marker, positive plasmid, and negative control with PA64S, respectively. The black arrow indicates the entire LRP expression cassette
