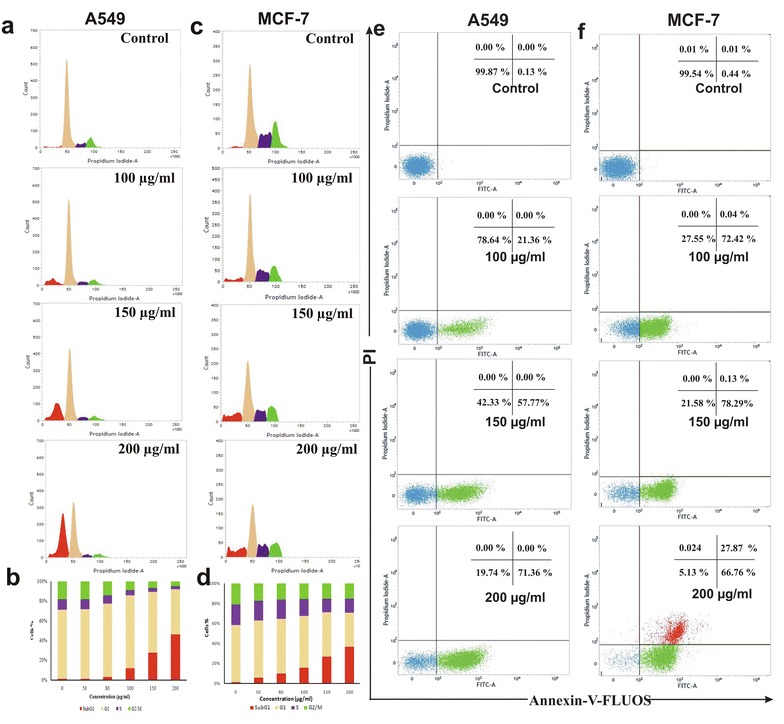
Fig. 2.

Flow cytometric analysis of A549 and MCF-7 cells treated with ETME (0–200 µg/ml). a Cell cycle phase distribution of A549 cells treated with indicated doses for 48 h, b Graphical representation of % cell population in all phases (Sub-G1, G1, S, and G2/M) for section A, c The phase of cell cycle distribution of MCF-7 cells after ETME treatment with indicated doses for 48 h, d Graphical representation of % cell population in all phases (Sub-G1, G1, S, and G2/M) for section B, e Apoptosis detection of A549 cells treated with indicated doses for 48 h, f Apoptosis detection of MCF-7 cells treated with indicated doses for 48 h
