Fig. 2.

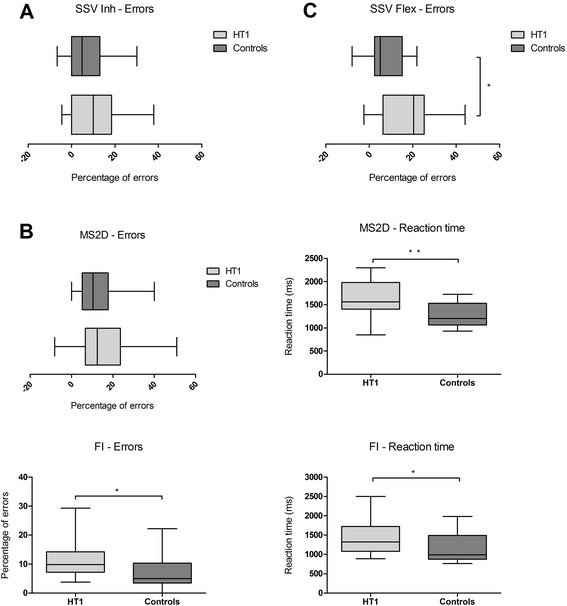
Performance on executive functions comparing HT1 patients and controls. Performance is expressed as percentage of errors and/or reaction time on tasks measuring inhibition a, working memory b and cognitive flexibility c *p < 0.05, **p < 0.01

Performance on executive functions comparing HT1 patients and controls. Performance is expressed as percentage of errors and/or reaction time on tasks measuring inhibition a, working memory b and cognitive flexibility c *p < 0.05, **p < 0.01