
Fig. 3.
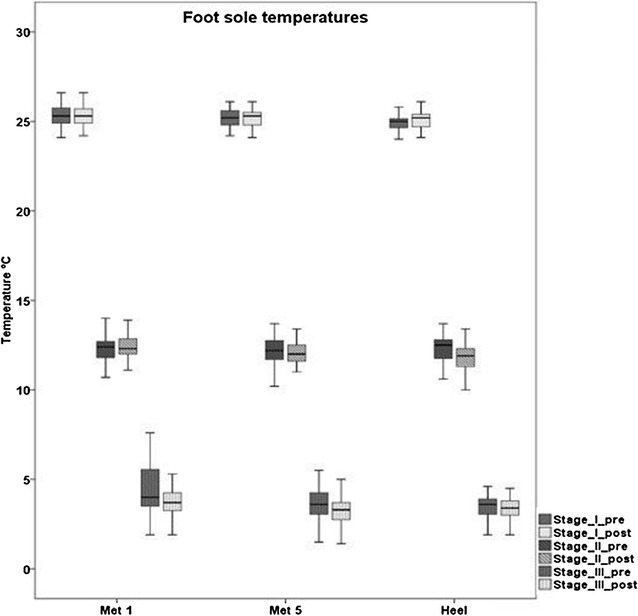
Boxplots of plantar foot temperatures of each anatomical location (Met 1, Met 5, Heel) and for each temperature stage (stage I, II, III) before and after the 12 trials
Official websites use .gov
A
.gov website belongs to an official
government organization in the United States.
Secure .gov websites use HTTPS
A lock (
) or https:// means you've safely
connected to the .gov website. Share sensitive
information only on official, secure websites.
Boxplots of plantar foot temperatures of each anatomical location (Met 1, Met 5, Heel) and for each temperature stage (stage I, II, III) before and after the 12 trials