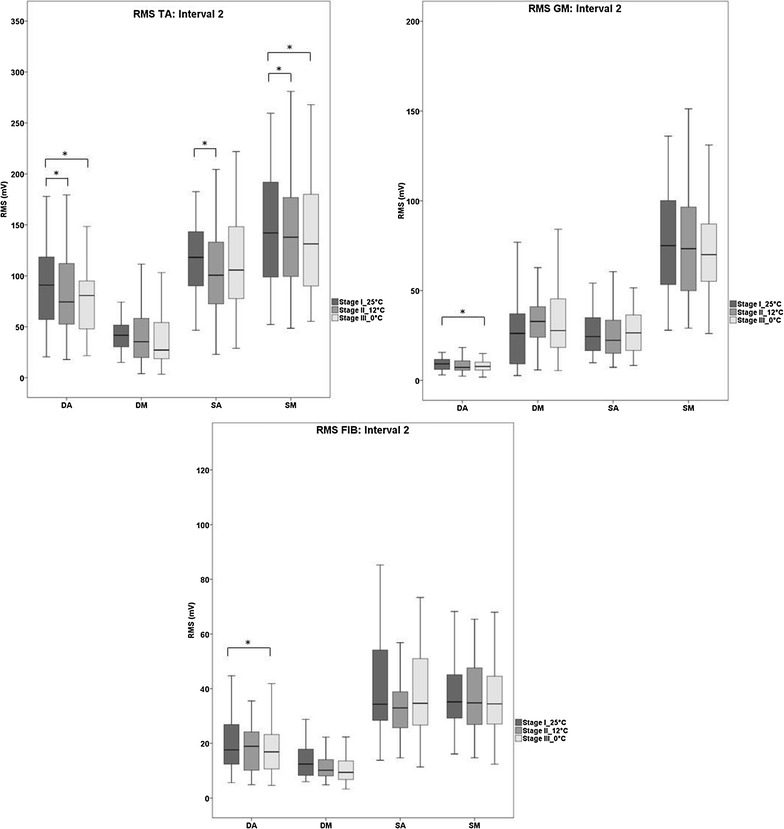
Fig. 5.

Boxplots of EMG values (RMS for TA, GM and FIB) for each condition (DA, DM, SA, SM) and each temperature stage for interval 2. Significant differences are marked with asterisks (*p < 0.017)

Boxplots of EMG values (RMS for TA, GM and FIB) for each condition (DA, DM, SA, SM) and each temperature stage for interval 2. Significant differences are marked with asterisks (*p < 0.017)