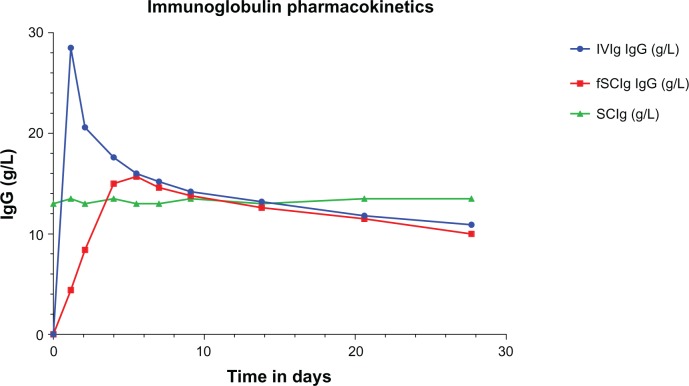
Figure 2.
Immunoglobulin (Ig) pharmacokinetics for intravenous (IVIg), subcutaneous (SCIg), and facilitated SCIg (fSCIg) administration. The graph shows an illustrative representation (not patient data) of the differences in the levels of IgG in the blood following IVIg in blue and fSCIg infusion in red, both given as a first infusion, compared with conventional SCIg in green, which is shown at a steady state over a 28-day time period. This shows the differences in the pharmacokinetics with the three methods of delivery, illustrating the loss of the peak level achieved with IVIg when fSCIg is used, followed by (from around day 12) the very similar gradual decline in IgG levels over time. SCIg is not represented from initiation of treatment, as this would take 3–6 months to reach a steady state unless an SCIg-loading regimen was employed.

