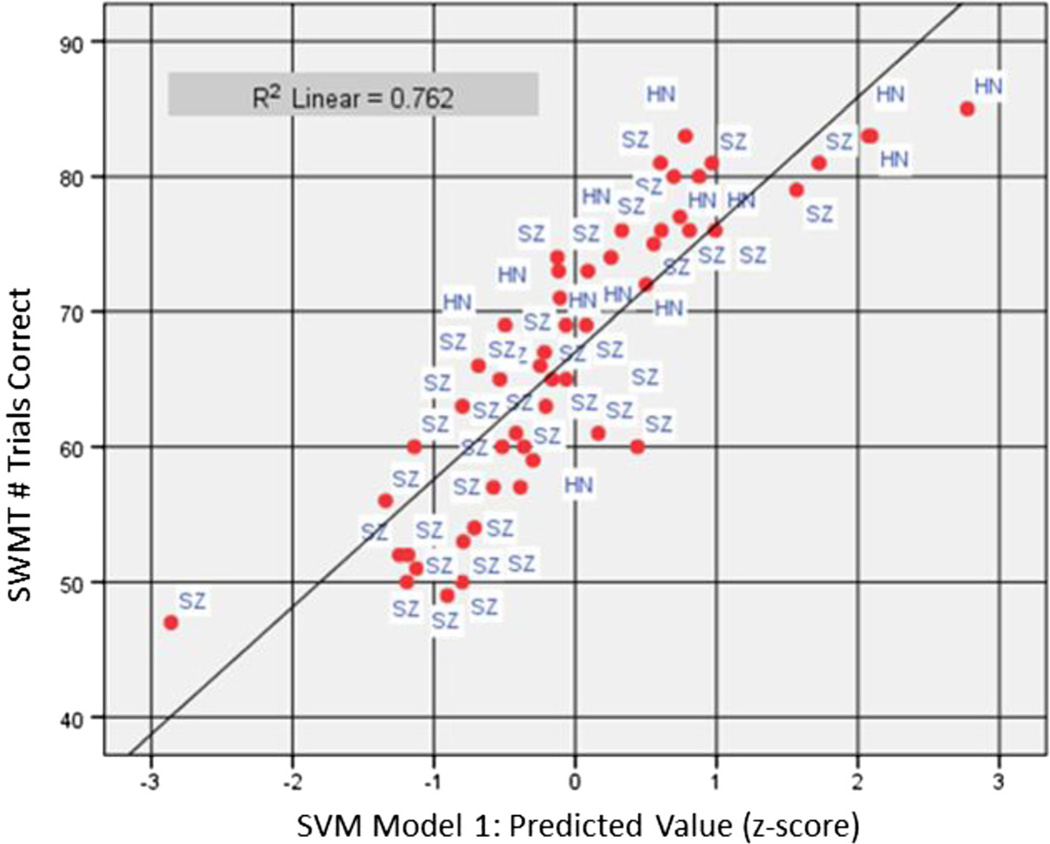
Fig. 2.
Scatterplot of Sternberg Working Memory Task (SWMT) performance (out of 90 trials possible) as predicted by SVM Model 1 across the full study sample (N = 52). Multiple regression explained 76 % of the variance in SWMT performance based on frontal gamma activity during encoding and central theta 1 activity during retention. Both correct and incorrect trials entered the model for each feature. SVM Model 1 score (x-axis) represents the residual difference between predicted (trend line) and observed value for SWMT performance

