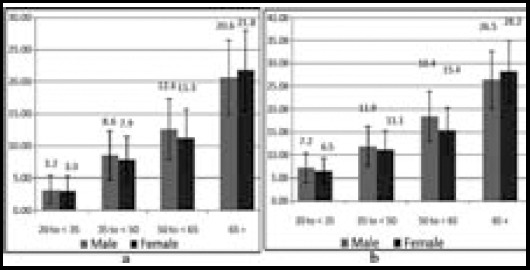
Fig.1.

(a) Age-specific prevalences rate of diabetes and (b) Age-specific prevalences rate of prediabetes and I-bar represent the 95% confidence interval.

(a) Age-specific prevalences rate of diabetes and (b) Age-specific prevalences rate of prediabetes and I-bar represent the 95% confidence interval.