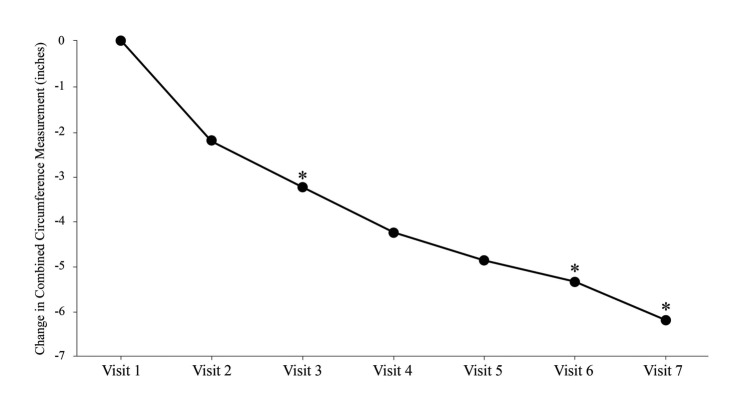
Figure 1.
Change in combined body circumference. Treatment 1 was performed at Visit 1 immediately after baseline circumference measures were obtained. The last treatment was performed at Visit 6 (Endpoint). Visit 7 was 2 weeks after the last treatment. Data represent the ITT population, (N=54). *denotes p<0.01 vs. baseline.

