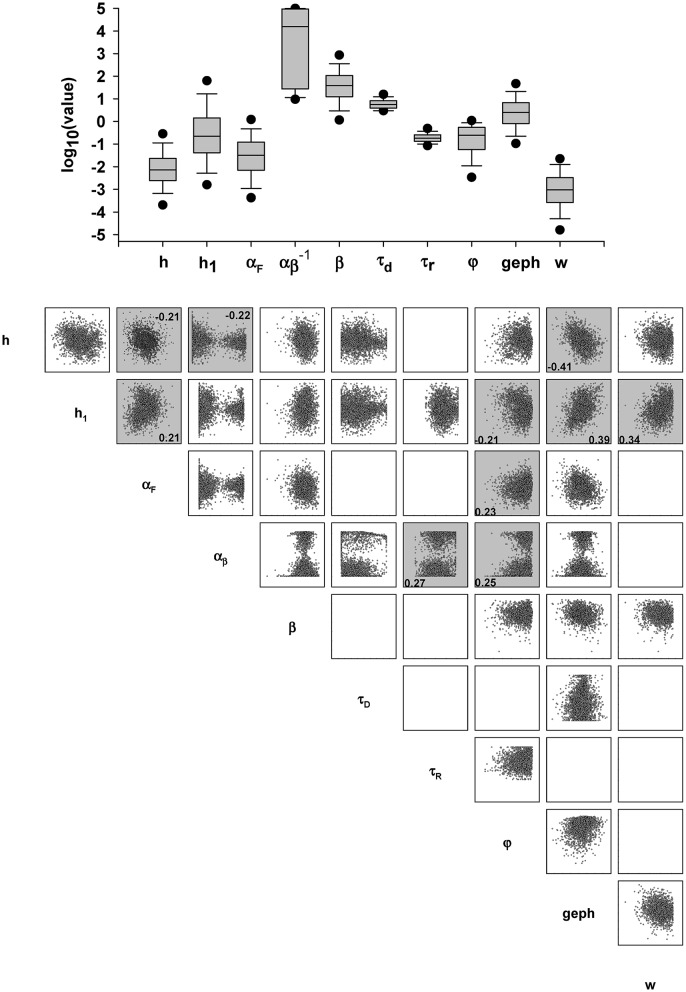
Figure 7.
Values and correlation of model parameters. Top: Box plot of the parameter values obtained for the best fit for all traces; Bottom: correlation matrix; colored squares indicate an absolute value for Spearman's correlation coefficient above 0.2. The actual value is reported in the relative plot and, to highlight the correlation, points were plotted in log scale.

